General Practice Data#
GP Profile#
The GP profile is a minimum data set about each of the practices your PHN supports.
When practices login to their GP Data Report, they will be requested to confirm that details held in the PHN Exchange about their practice are correct. The following profile field will appear for each practice as they log into their GP Data Report.
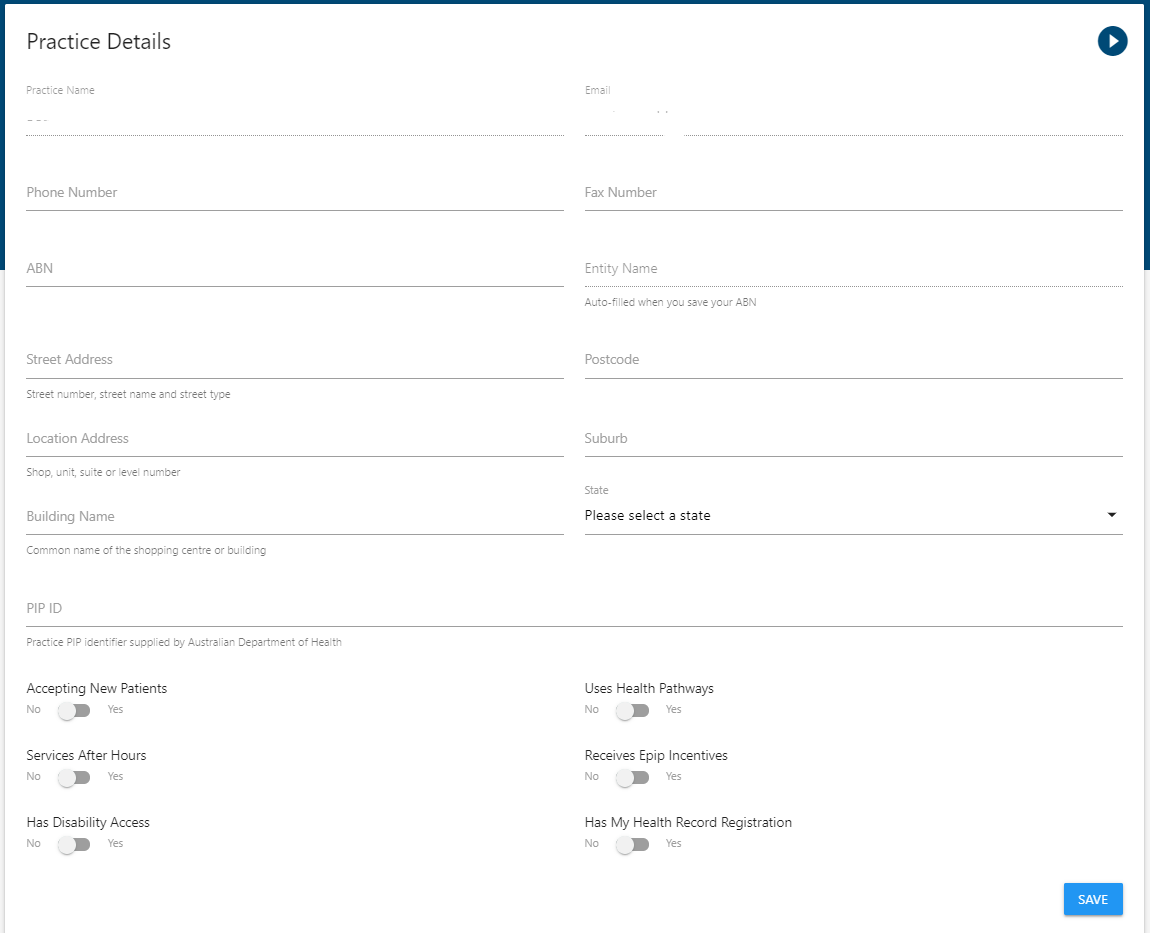
This information should be regarded as the one source of truth, and it is this information that should be transcribed into your PHN’s client relationship management system.
A customised verserion of Dynamics 365 customer relationship management systems is recommended to be used in conjunction with the PHN Exchange.
GP Data report#
The capability of automated reporting at an incidence level is unique to the GP Data Report and can interface with any of the multiple software programs currently used in the primary care sector.
The GP Data Report is tailored for each practice and displays practice trends and regional and catchment-wide comparisons, so GPs can make informed decisions about their patients, workforce and practice.
The graphical data monitors areas such as demographics, disease prevalence, immunisation status, cancer screening rates and activities of patients with chronic disease.
This allows practices to identify gaps, improve detection rates, use early interventions and achieve better outcomes.
Reports also include patient indicators across focus areas including cardiovascular disease, respiratory disorders and diabetes.
The dashboard reports display constant 15-month trends and are updated monthly.
This automated process saves a practice significant time in producing reports and can also be used as evidence of data monitoring and quality improvement activities for accreditation.
Benchmarking#
A unique feature of the GP Data Report is its ability to benchmark shared data. Each practice views their own data and averages calculated from all data sharing practices. This enables the practice to assess their performance against their peers.
Of course, all practice specific data is only viewable by the practice sharing its data. Please see below for an explanation of benchmarking
Example 1#
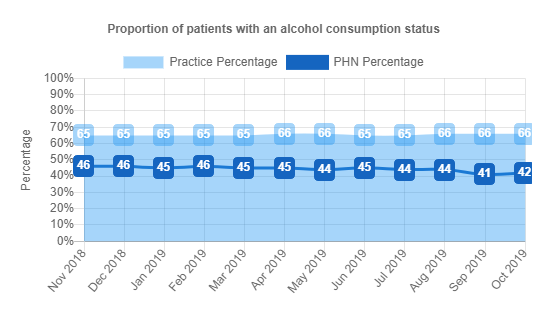
The chart below displays one of the PIP QI measures for a practice. In this case there is a view of the last 15 months and this chart shows that as of October 2019, the practice has recorded an alcohol consumption status for 66% of its patients. This is compared to the benchmark average of all data sharing practices of 42%
Example 2#
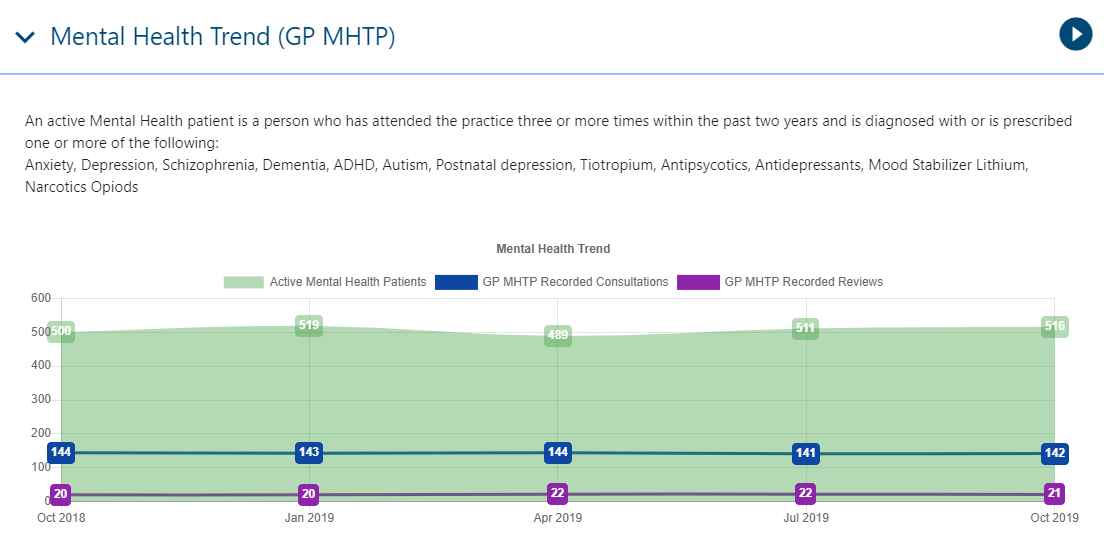
In this example, as of October 2019, the practice has 516 active patients diagnosed with a mental health condition or prescribed one or more certain medications. We can also see that only 142 patients have a Mental Health Treatment Plan recorded and only 21 have Mental Health Treatment Plan reviews
Validating#
GP Engagement Validating the GP data report (2 min 11 secs) CLICK HERE.
GP Data Source#
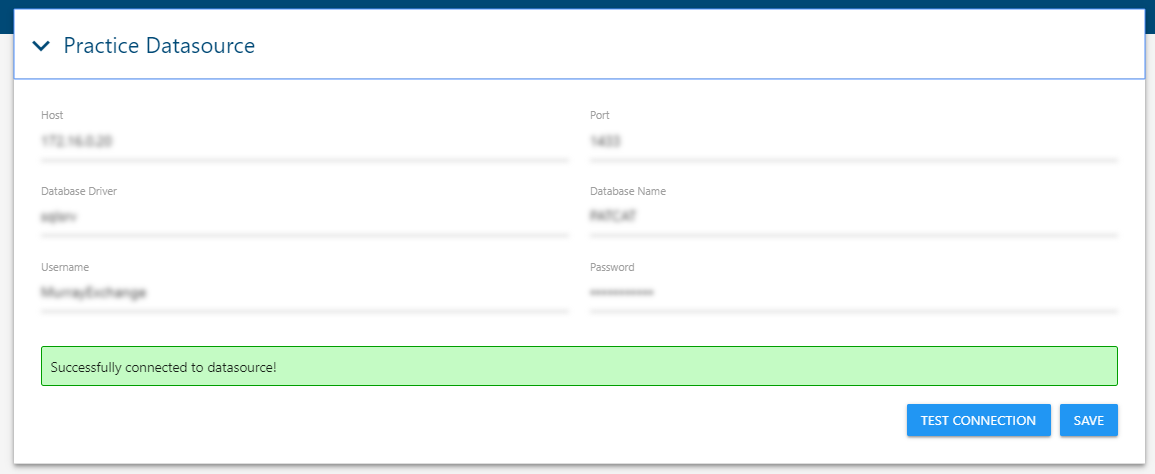
Configuration for the GP data extraction is found within the Admin page. It shows the individual connection details between the PHN Exchange and your PHN's GP Data source (The database of extracted and de-identified GP Data, held by and under the custodianship of your PHN). Only designated people within the PHN should modify or edit this section.
Note that the PHN Exchange does not use individual lines of data but rather aggregates numbers within the PHN's database and sends the aggregates back to the PHN Exchange for visualisations to the GP Practice.
The PHN Exchange sends a database query to the PHN’s database and calculates the number of patients for a practice on the PHNs data base. This number is sent back to the PHN Exchange. When a practice logs into their GP Data Report, the number is used to generate the graph.